Comparing Scenarios
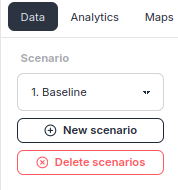
Adding a Scenario
Click the New scenario button.
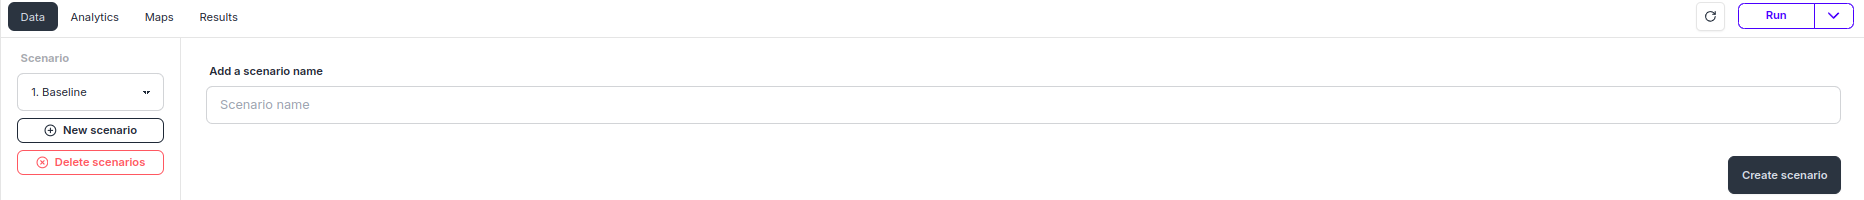
Enter a scenario name, then click Create scenario to create it.
The newly added scenario can be selected from the dropdown. Select the newly created scenario.
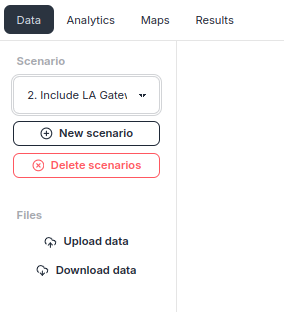
Upload data and run the optimization.
Uploading Data
Click Upload data.
Click CHOOSE FILE, select your Excel file, then click Import to upload the data.
WARNING
The Excel file must be formatted according to the Excel File Format.
The upload completes with a success message.
If you encounter errors during data upload
Reviewing Uploaded Data
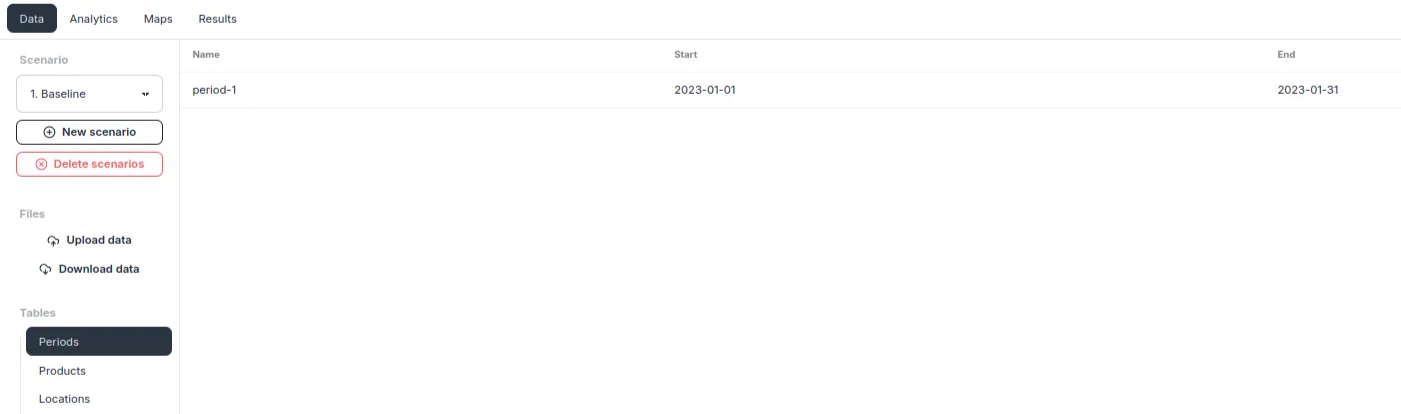
You can review the uploaded data in the Data tab. Here, select Periods from the Tables list.
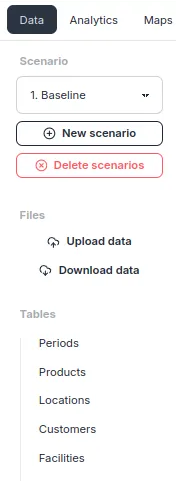
Selecting Periods displays the data from the Periods sheet, allowing you to verify the uploaded content.
Running the Optimization
Run the optimization on the uploaded data using the Run button in the upper right of the screen.
Use the dropdown menu to select the target scenario and configure run options. Once configured, click Run to start the optimization.
When the run starts, the status changes to Running. Computation time depends on two factors: the size of the supply chain and the available compute resources.
When the run completes, a Success message appears in the bottom right of the screen. 🎉
If you encounter errors during optimization
Comparing with Charts
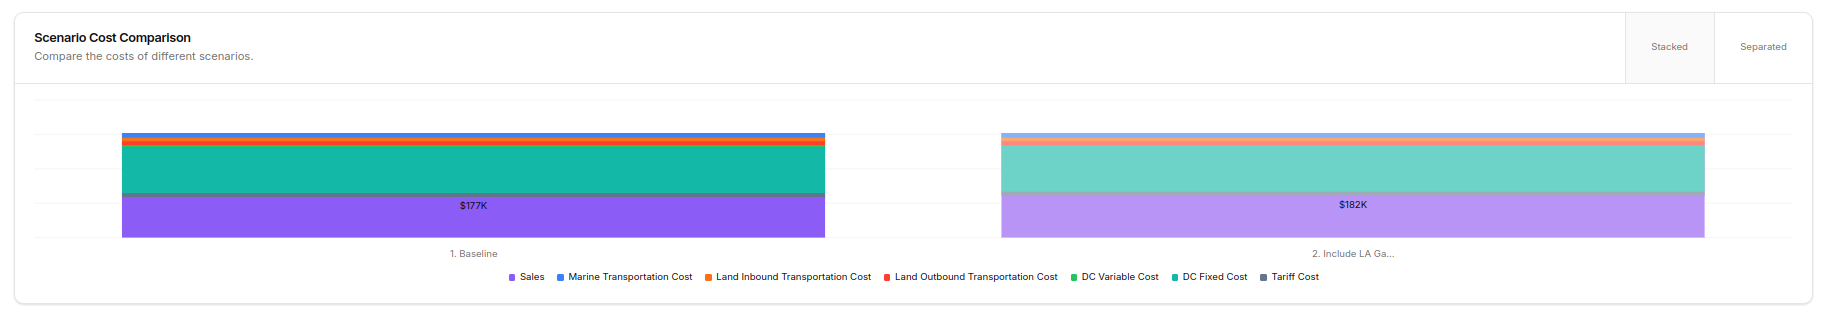
You can compare costs across scenarios using stacked bar charts. Revenue and costs are displayed, with the purple section representing profit. The right-side scenario shows higher profitability.
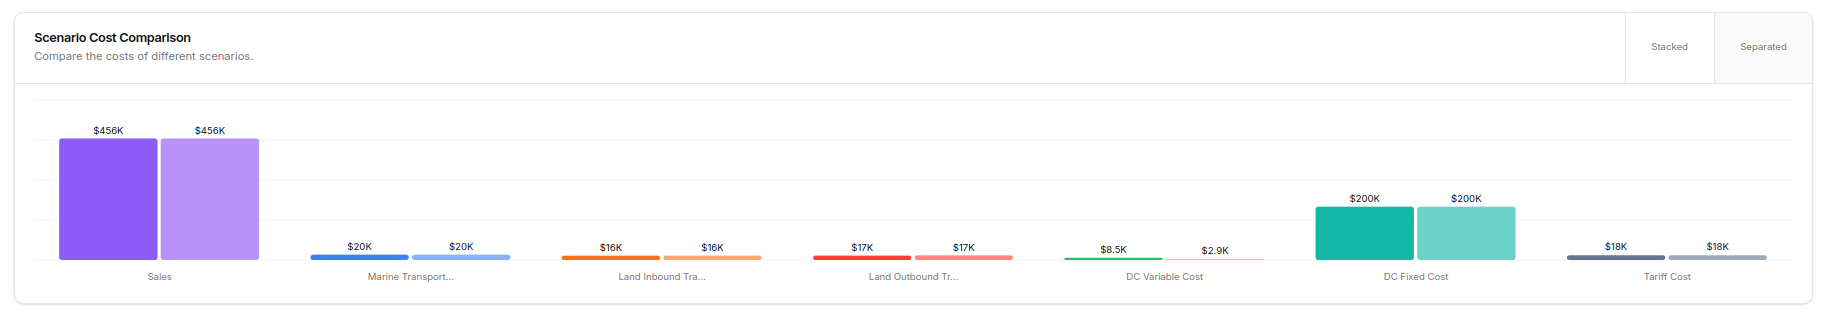
You can also compare individual cost categories between scenarios. Both scenarios have the same revenue, but the right-side scenario shows lower DC Variable Cost.
More comparable metrics are planned for future releases.
Available Metrics
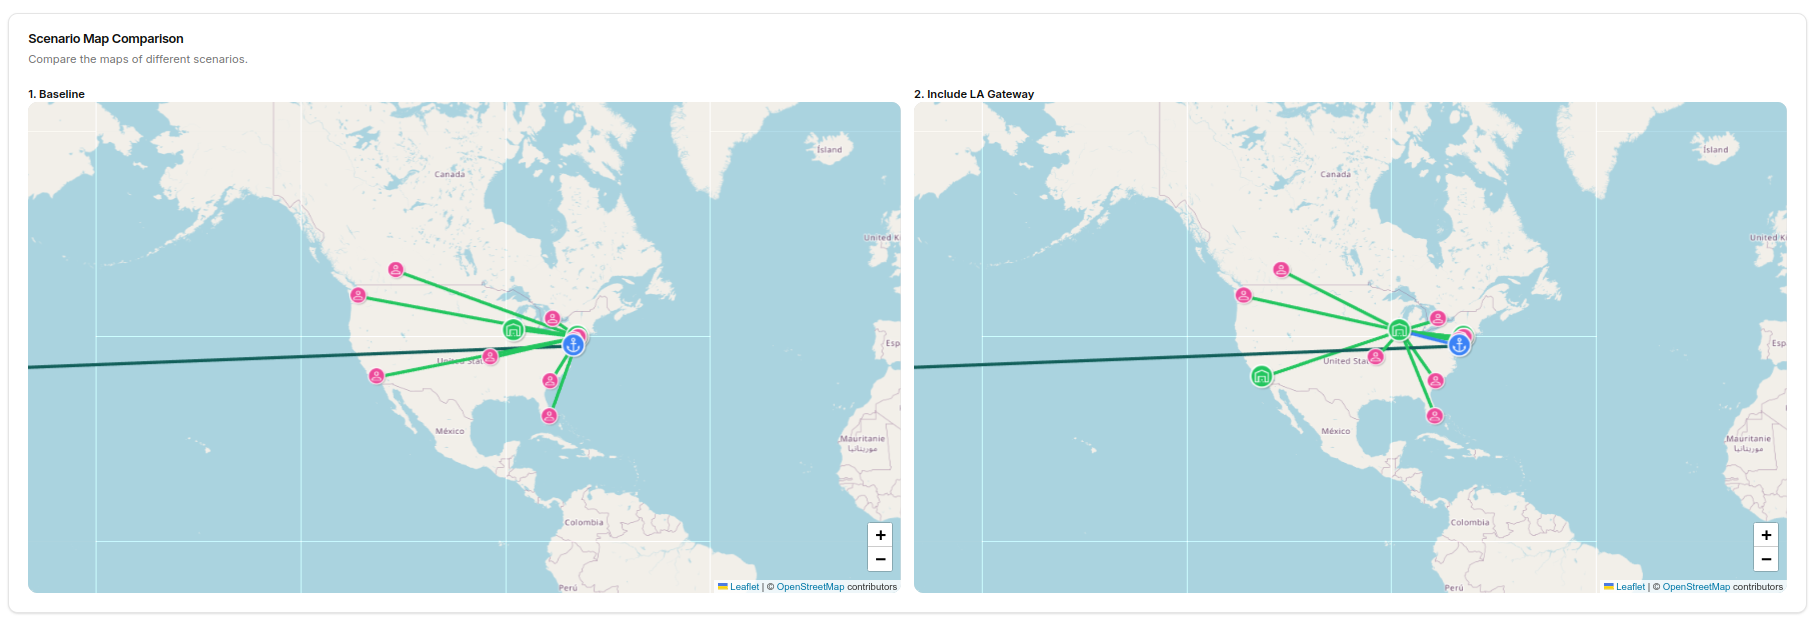
Comparing Networks
You can compare networks plotted on a map.